


Three years ago, the US and EU launched the Global Methane Pledge at COP26 in Glasgow. It was the first major attempt to tackle this extremely potent greenhouse gas, which has been responsible for an estimated 30% of global warming to date. How much progress have the signatories made towards reaching their 2030 methane-emission reduction targets?
To answer this question, we measured annual methane emissions from 13 large fossil-fuel basins spread across nine major producing countries, including six GMP signatories. The countries were selected according to two main criteria: the size of their production and the availability of high-integrity, reliable data. They include large producers from a wide range of geographies, including North America (the US), the MENA region (Iran, Iraq, Kuwait and Algeria), Central Asia (Turkmenistan and Uzbekistan), Sub-Saharan Africa (South Africa) and Australia.
The results overall are sobering.
- Aggregate methane emissions from the sample are continuing to increase, not decrease. This is cause for concern: the longer we take to reduce emissions, the steeper the abatement curve will have to be to achieve 2030 targets. Further delays risk compromising the chances of delivering on the Pledge, while severely undermining the confidence of civil society in methane reduction policies.
- In most fossil-fuel producers in the sample, methane emissions are up significantly from 2020 levels (the reference year). “Worst-in-class” performers – countries where emissions have risen at the fastest pace since 2020 – include all three non-signatories of the GMP in the sample, as well as the US. South Africa shows the steepest rise in methane emissions, with coal-mine emissions up nearly 40% in 2023 versus 2020.
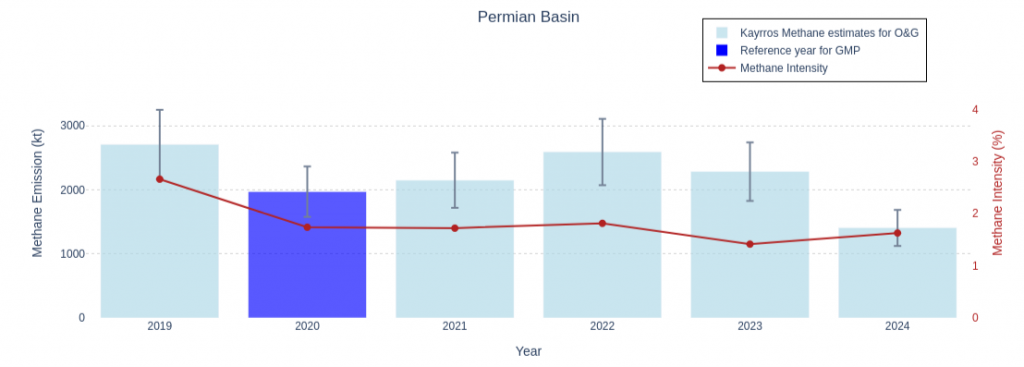
- Among GMP signatories, the US stands out as the one with both the largest level of emissions overall and the steepest emissions growth, likely due to fast-rising oil and gas production. Aggregate emissions from three of its largest basins – the Permian, Anadarko and Appalachian – increased by 20% from 2020 levels. The methane intensity of US oil and gas production edged down in 2023, however, as output increased faster than associated emissions. The Permian also outperformed the other basins, achieving the steepest decline in emissions in 2023 despite consistently showing the fastest production growth since 2020.
- Two countries outshine the others in emission cuts: Australia and Turkmenistan. Both countries joined the GMP in 2023. Australian emissions from the Bowen Basin, a major coal producing region, dropped by 27%. Turkmenistan methane emissions have been trending lower and are now expected to fall steeply in the wake of new commitments and policy measures.
- The window of opportunity to tackle methane emissions is narrowing. Delayed action will only make the challenge of meeting the 2030 goal all the steeper. Although abatement may soon accelerate as new policies enter the implementation phase, regulations that would specifically target super-emitters as a priority would presumably achieve faster results. Earth observation technologies will play an even more important role in this new phase than they have in enabling new methane policies and regulations in the first place.
The Global Methane Pledge, launched by the US and EU at COP26 in Glasgow, marks the first major concerted effort to tackle man-made emissions of methane, a potent greenhouse gas responsible for some 30% of global warming to date. Signatory countries, of which there are now 158, are committed to the goal of cutting global anthropogenic methane emissions by 30% by 2030 from 2020 levels. The fossil fuel industry is responsible for an estimated 40% of anthropogenic emissions and presents the best abatement potential, and consequently has been the main target of methane policies to date.
Earth observation (EO) technologies have been foundational to the Global Methane Pledge since its very launch, thanks to the spotlight they have cast on man-made methane emissions and the unprecedented abatement opportunities this new transparency has unlocked. At the launch ceremony in Glasgow in 2021, US Climate Envoy John Kerry pointed in his presentation to a groundbreaking article that The Washington Post had just published on Russian methane emissions. That article had received significant input from Kayrros and heavily relied on our detections of super-emitters from Russia’s Yamal and Brotherhood gas pipelines.
Three years later, we again leverage EO technologies to assess how far along signatory countries are in reaching the 2030 goal. Rather than focusing on super-emitters, in this case we measure annual basin-wide emissions from 13 major fossil fuel basins (coal, gas and oil) spread across nine countries, including six signatories of the Pledge. Our findings are sobering.
Methodology
Kayrros assessed basin-wide emissions from 13 major coal, oil and gas basins using basin inversions based on data from the TROPOspheric Monitoring Instrument (TROPOMI) on board the Sentinel-5 Precursor satellite, part of the European Space Agency’s Copernicus constellation. TROPOMI orbits Earth and takes frequent, detailed measurements of methane concentrations in the atmosphere. We use these measurements, along with other data such as wind patterns and known methane sinks, in complex mathematical models. These models “invert” the problem: instead of predicting methane concentrations from known emissions, they estimate emissions based on observed concentrations. A peer-reviewed description of the methodology was published in iScience in 2023 and can be found at: https://www.sciencedirect.com/science/article/pii/S2589004223024525
The basins under review were selected on two main criteria: the size of their production and the availability of high-quality, high-integrity TROPOMI data. We focus on fossil fuel emissions as an indicator of a country’s emission trajectory for two reasons: because of the large share of fossil fuels in overall man-made methane emissions; and because these emissions are highly concentrated and comparatively easy to abate, which has made them the main target of methane abatement policies to date.
It should be noted that our basin-inversion methodology may not always allow us to precisely identify the point sources responsible for the aggregated emissions that we set out to measure. Thus, emissions attributed to oil and gas basins may also include some emissions from co-located agricultural or waste-management facilities. Total emissions attributed to coal basins in Australia or South Africa may also include emissions from cattle farming in these areas or adjacent coalbed methane production facilities. This level of uncertainty is irrelevant to our overall assessment of the trajectory of methane emissions in these regions, however.
An Alarming Trajectory
Overall emissions from the basins and countries under review are continuing to increase, not decline. This is cause for grave concern, given the extreme urgency of reducing methane, which has more than 80 times the global warming power of carbon dioxide in the first 20 years. Any delay in reducing methane emissions will clearly make the challenge of achieving 2030 reduction targets all the more daunting, and will gravely compromise our attempts to avoid the most catastrophic effects of global warming. It also risks undermining public confidence in methane abatement policies. Overall, emissions from the sample of basins and countries under study increased by 7% in 2023 versus levels observed in the 2020 reference year, a headline figure that admittedly conceals distinct patterns across geographies.
This continued growth in overall methane emissions from fossil fuels has occurred despite undeniable advances on the policy front, notably in the US and EU, with the passage of landmark legislation designed to rapidly curb emissions. By mid-2024, however, most of these regulations had yet to enter their implementation phase and had not had a visible impact on emissions levels. Additionally, these legislations have not specifically targeted the lowest-hanging fruits, i.e. measures that could potentially have yielded faster results, such as an outright ban on methane super-emitters.
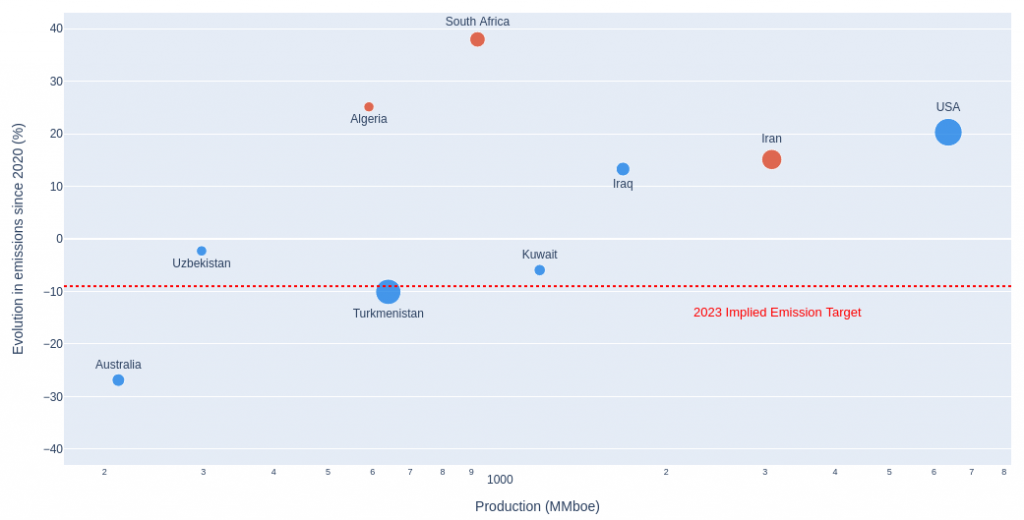
Fig.: Change in annual methane emissions from fossil fuel basins, 2023 vs. 2020
Diverging patterns
In the chart above, the red dotted line indicates the notional level of emissions which individual countries should have achieved in 2023 if they were on a linear path to reach a 30% reduction in domestic emissions by 2030. (Note that the Global Methane Pledge does not specifically set a 30% domestic reduction target for each signatory country but a global one.) Only two of the GMP signatories in the study are below the line, Turkmenistan and Australia. All others are above it. Perhaps unsurprisingly, the “worst” performers of our sample include all three countries in this group that have not yet signed onto the Global Methane Pledge, namely South Africa, Iran and Algeria. Perhaps more surprisingly, the U.S., one of the main driving forces behind the Pledge, also stands out as both the country in the sample with the highest level of aggregate emissions and the GMP signatory with the fastest methane emission growth. Two countries have succeeded in reducing emissions but not at the pace required by a notional linear progression towards the 2030 goal.
Non-signatories
Iran stands out as the largest emitter for 2023 among the three non-signatory countries in the sample.
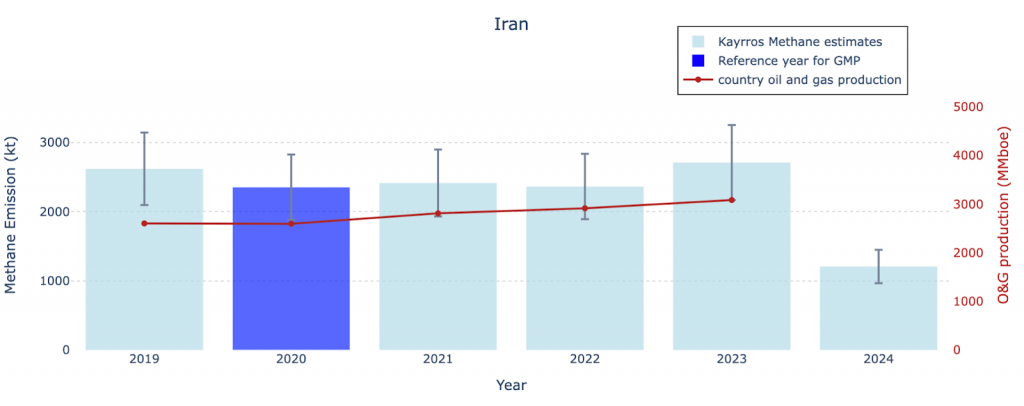
Source: Kayrros (Emissions), EIA (Production)
While our assessment of the methane footprint of a given country does not in itself provide any clue as to the underlying factors responsible for it, the spike in Iranian methane emissions coincided in 2023 with a substantial increase in oil production, which according to third-party estimates surged to its highest level in five years. So did its methane emissions also rise to new highs. This may in part reflect the fact that Iran (under US sanctions) does not appear to have invested in takeaway capacity to dispose of the associated gas, at least some of which may have been vented or inefficiently flared.
The South Iranian Basin is contributing the vast majority of these observed emissions, with additional emissions coming from fields near the border with Turkmenistan. This observation of rise in Iranian methane emissions appears consistent with recent findings by the World Bank of a large increase in Iranian gas flaring, suggesting that Iran is producing more gas than it can consume or otherwise dispose of.
China is widely considered to be the main market outlet for US-sanctioned Iranian oil. Rising Iranian methane emissions thus suggests that China’s imported methane emissions have also been steeply on the rise.
Source: Kayrros (Emissions), EIA (Production)
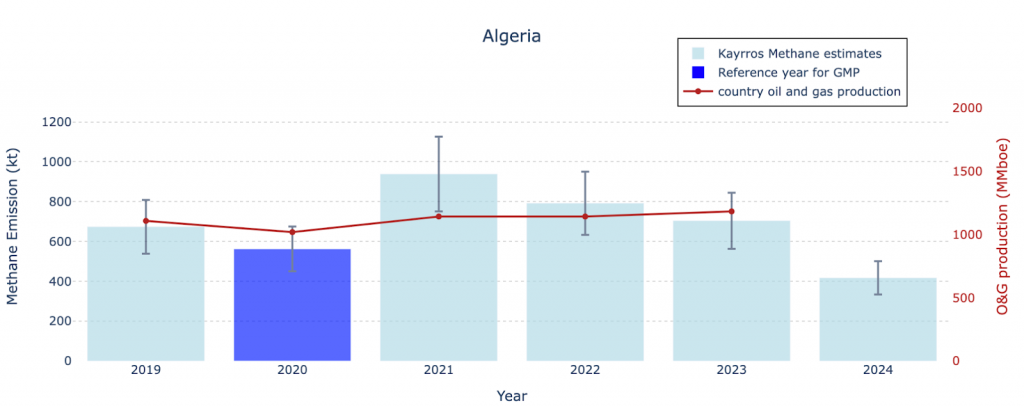
Emissions from Algeria’s Hassi R’Mel basin, the country’s largest gas producing basin, spiked by 65% in 2021 as national oil and gas production bounced back from 2020 Covid lows. Emissions retraced some of those gains in 2022 and again in 2023 but have yet to fall back to pre-Covid levels.
A long-producing basin with aging infrastructure dating back to the 1960s, Hassi R’Mel is one of Algeria’s main sources of methane emissions. New EU methane rules could lead to vast improvements in Algerian methane emissions, however, as the country positions itself to be a key partner in Europe’s quest for energy security post-Ukraine invasion. The EU and Algeria have announced plans to collaborate under the EU “You Collect, We Buy” scheme designed to incentivize companies to capture and commercialize gas that would otherwise go to waste through venting and flaring. The EU has said it and Algeria would pilot together this scheme.
Source: Kayrros (Emissions), Statista (Production)
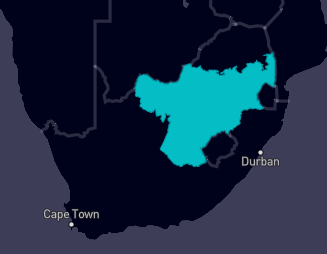
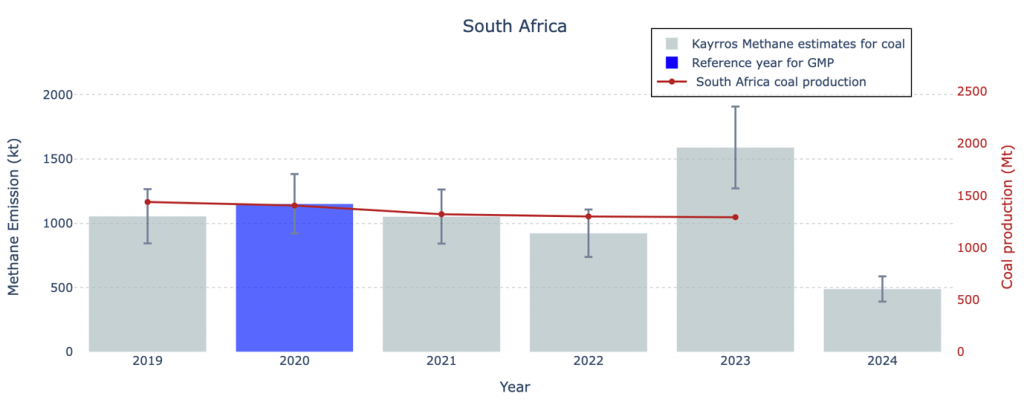
South African Coal basin
South Africa, a large coal producer, experienced a steep rise in methane emissions from coal-producing regions in 2023 without any reported increase in production. That surge then reversed declines experienced in the previous two years, leaving annual emissions nearly 40% above 2020 levels. Emissions in the first half of 2024 appear to have returned to levels more closely aligned with previous patterns.
Growing demand is expected for coal following the recent commissioning of Kusile Unit 5 coal power station, but the reasons for the 2023 emission spike appear unclear. The sudden increase may have been due to one-off operational glitches in the country’s coal-liquefaction industry, which turns coal into synthetic fuels and chemicals. Most of the methane concentration detected by TROPOMI appears to be located around coal-liquefaction facilities. Another potential factor could be a possible spike in “artisanal” coal mining as tight electricity balances and industry lobbying reportedly caused earlier coal phase-out measures to be watered down or delayed.
The case of the U.S.
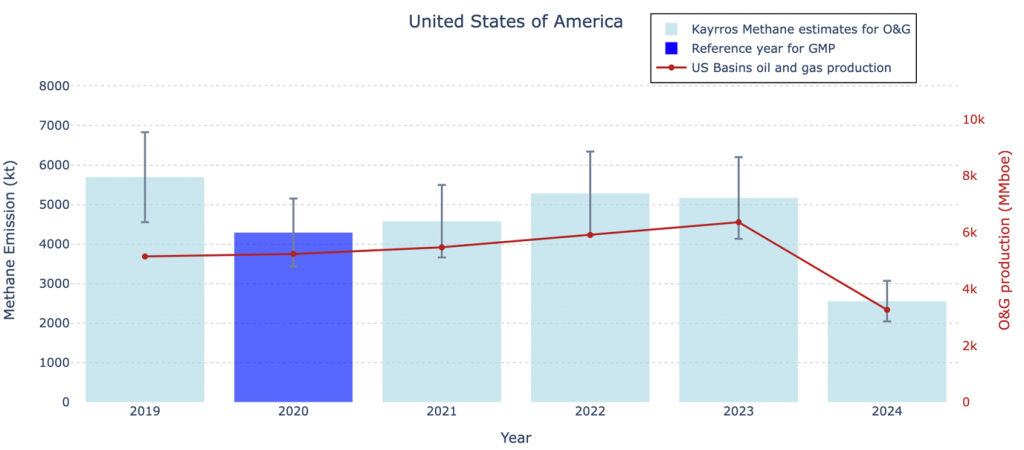
Source: Kayrros (Emissions), U.S. EIA (Production)
Among GMP signatories, the three U.S. basins under review – the Permian, Anadarko and Appalachian basins – show both the largest volume of aggregate methane emissions overall and the steepest growth in emissions over time. In aggregate, emissions from these three prolific basins rose 20% in 2023 from 2020 levels, far from the 9% reduction where a linear progression towards 2030 abatement goals would require them to be.
The U.S. has been ramping up oil production at a fast pace in the three years since the onset of the Covid-19 pandemic, led by the Permian and other tight oil and gas basins (commonly referred to as shale oil and gas basins). Aggregate production of oil and gas from the three basins under review, measured in barrels of oil equivalent, surged by 21% in 2023 versus 2020, according to U.S. EIA estimates. This growth was likely the main factor behind the increase in associated methane emissions.
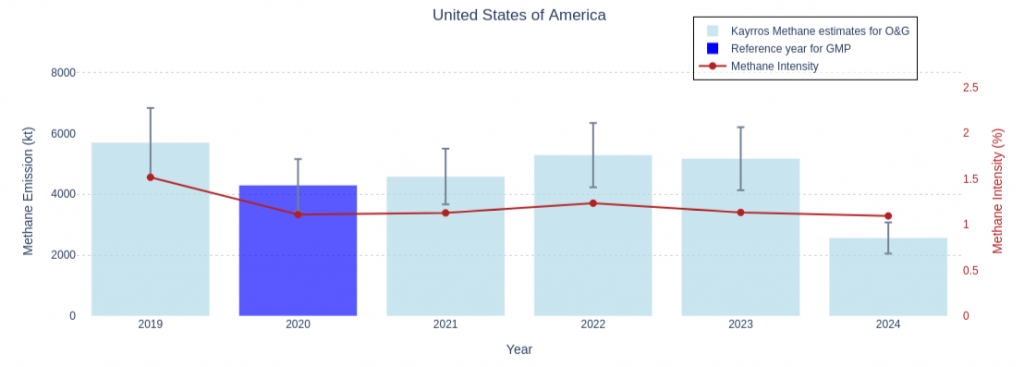
On a brighter note, methane emissions from the three basins edged down in 2023 year-on-year, even as oil and gas production continued to increase. This resulted in a slight dip in the methane intensity of oil and gas production, a dip that appears to have extended into the first half of 2024, leaving average methane intensity for the first six months slightly below 2020 levels.
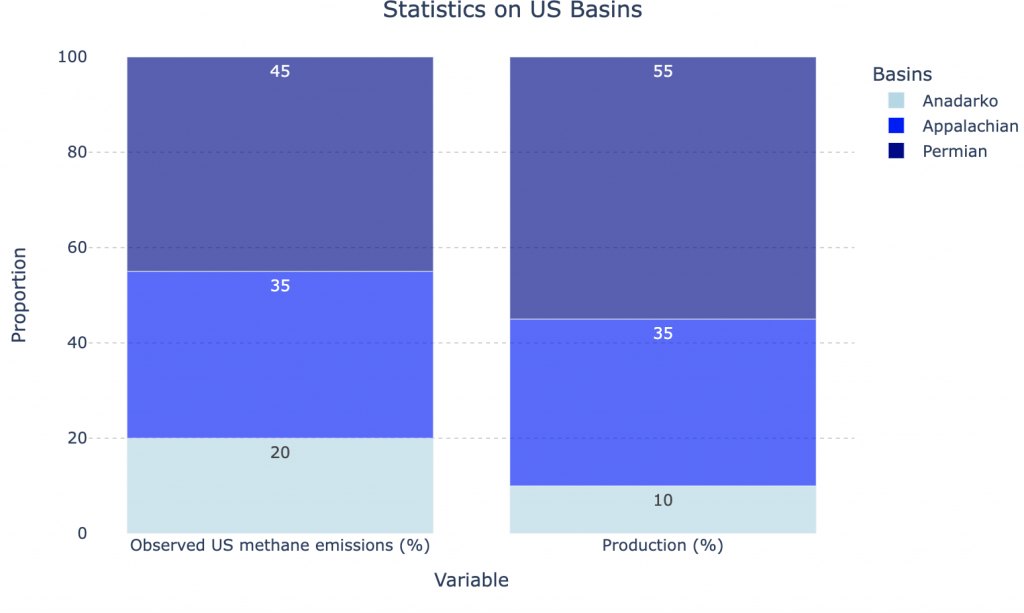
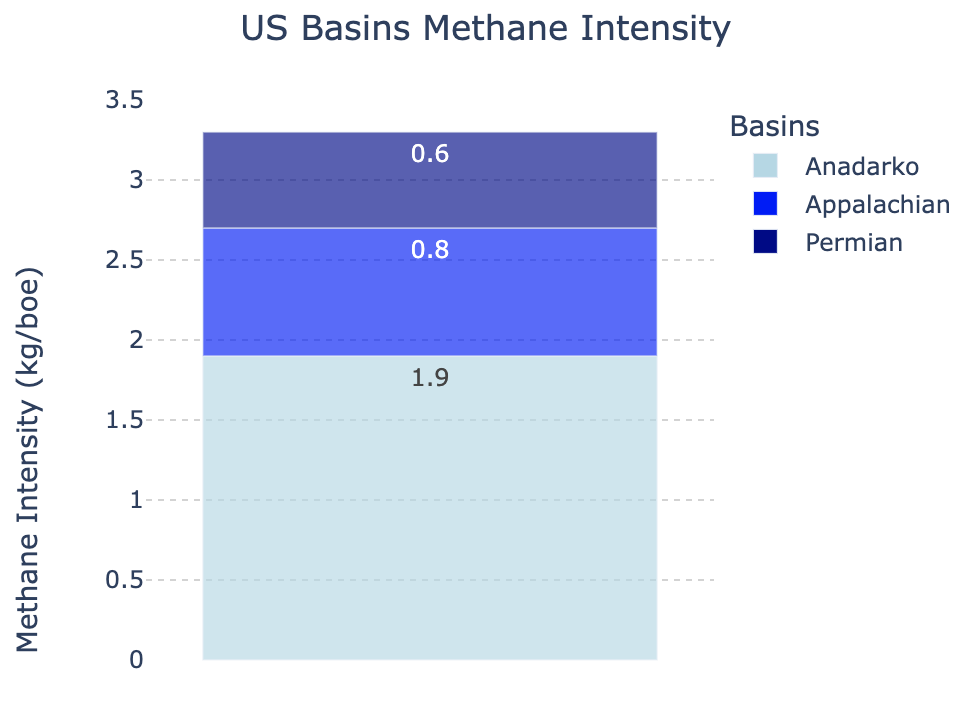
Headline US emission figures conceal sharp differences across basins. The Permian, the world’s most prolific oil basin, accounted for more than half of the aggregate oil and gas production from the three basins under review in our study, but a much lower share of methane emissions. In contrast, the Anadarko made up only 10% of the three basins’ aggregate production, but its share of emissions was twice as large. Put differently, the methane intensity of Permian production in 2023, calculated as the ratio of methane emissions over the sum of oil and gas production, was less than one third that of Anadarko production. The methane intensity of large, publicly-traded companies operating in the Permian was presumably even lower, but our study does not permit us to disaggregate it from that of the basin’s many smaller, privately owned producers.
This is not, however, how the methane intensity of Permian natural gas is currently calculated in the scientific literature or reporting initiatives such as the one promoted by OGCI. According to common standards, the methane intensity of gas from any given US basin is determined as the ratio of methane emissions from oil and gas production in that basin over the sum of its gas production. According to that approach, the methane intensity of natural gas from the Permian basin, a predominantly oil-producing basin but a top source of feedgas for the US LNG industry, is substantially higher than the average of the three basins in our study. A key benefit of calculating methane intensity in this way is that it more clearly represents the opportunity cost of venting and the proportion and volume of natural gas that could be consumed or that could generate commercial revenue if it were not wasted into the atmosphere.
“Best-in-class”
Two recent GMP signatory countries, Australia and Turkmenistan, both of which signed the Pledge in 2023, stand out as the best performers in our cohort in terms of reducing methane emissions from 2020 levels. These two fossil fuel producers look on the right track, with Australian emissions significantly below their notional 2023 target.
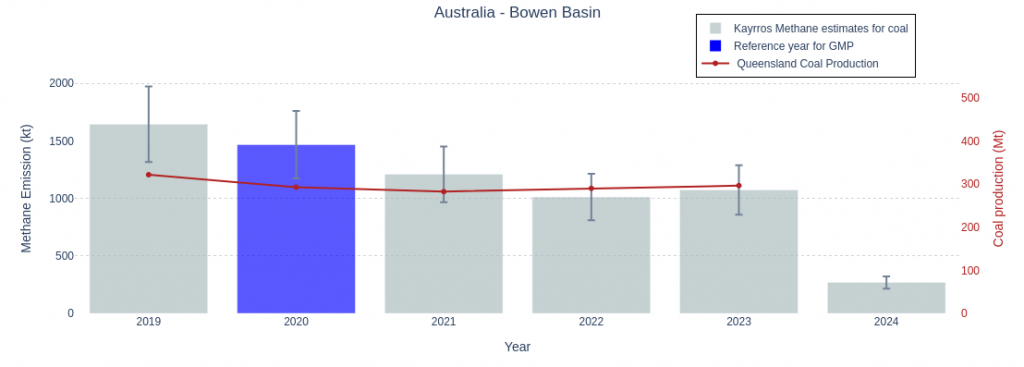
Australia’s methane emissions from the Bowen basin, one of the world’s top coal producing basins, fell steadily in 2021 and 2022, bouncing back up only marginally in 2023. Despite that partial rebound, the basin showed a 27% drop in emissions as venting/flaring of coal seam gas seems to have decreased since 2020. How much of the decline is due to new government policies, improvements in operating practices or the retirement of deep, aging mines that had been responsible for a disproportionate share of emissions remains to be seen. Emissions in the first half of 2024 appeared even lower.
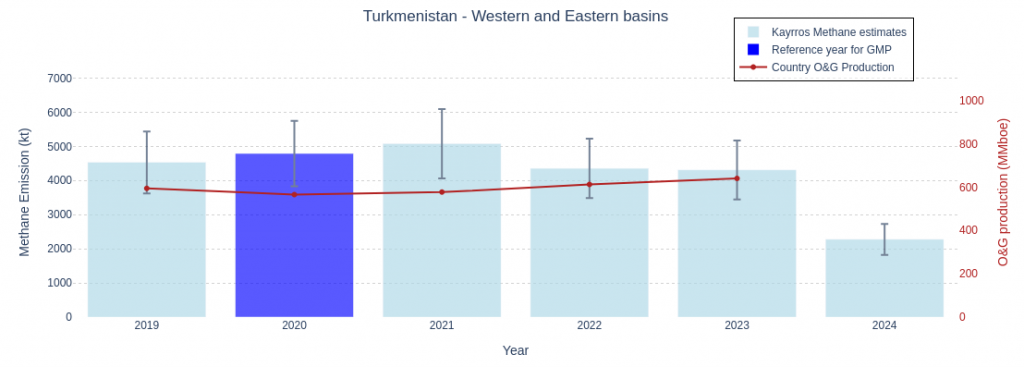
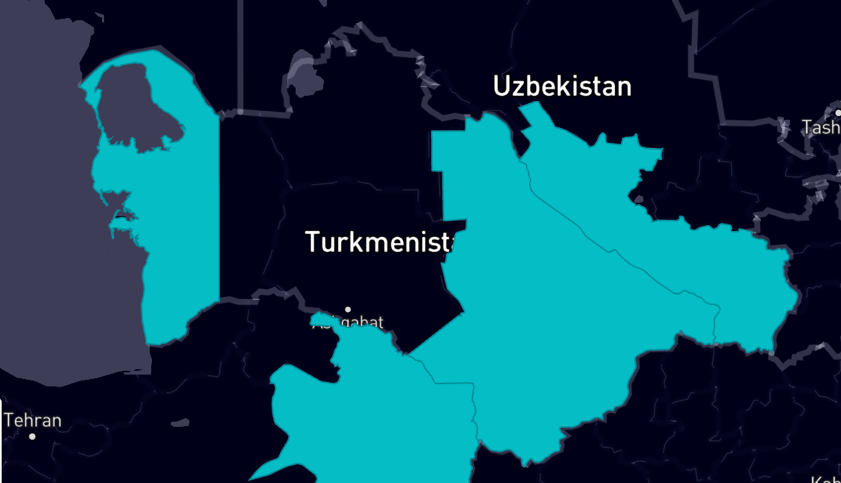
Turkmenistan’s aggregate methane emissions from its Eastern and Western producing regions, despite a brief increase in 2021, have been trending lower since that peak, even as oil and gas production has been on the rise. Aggregate emissions for 2023 were down by 10% versus 2020, a slightly steeper reduction than the 9% notional cut required in a linear progression towards 2030 targets.
Until now, most of the decline in emissions has come from the Eastern part of the country, where the bulk of gas production is located. The Western part is mostly producing oil. Emissions from both producing regions look set to now fall steeply in the wake of new commitments and policy measures announced by Ashgabat over the last year.
The way forward
On paper, delays in achieving reductions in methane emissions translate into the need for even steeper cutbacks for the remainder of the decade if we are to achieve the Pledge’s 2030 abatement goal. In practice, of course, methane emission cuts may be unevenly distributed not only geographically but also temporally, in terms of their timeline. The next few years should see a rapid acceleration of emission reductions, as landmark methane regulations that have been adopted since the launch of the Pledge, notably in the US and EU, enter their implementation phase. Nevertheless, it is remarkable that, based on our admittedly limited sample and despite some notable improvements, the fossil fuel industry has not on balance managed to get ahead of these regulations and deliver any meaningful reduction in its global footprint. On the contrary, that footprint has actually continued to increase overall in the three years since the GMP launch.
Aside from the inevitable delays in policy execution, it may also be that the methane legislations that have been adopted so far have not been optimized to deliver the fastest reductions possible. Regulations that would have specifically targeted so-called super-emitters might have achieved faster impacts. Although super-emitters only account for a fraction of total fossil-fuel emissions, these sources are highly concentrated and technically easy to abate at minimal cost. Super-emitters are also morally indefensible, as in many cases they are not inadvertent or accidental but rather result from deliberate venting practices that should no longer be tolerated.
Just as Earth observation technologies have been instrumental in getting the Global Methane Pledge and following methane regulations off the ground, so too will EO continue to play a key role in their implementation phase. EO-based monitoring technologies continue to improve, with advances both on the processing side and the hardware side, including the launch of MethaneSat, Tanager-1 and other new sensors. EO will be instrumental in executing the new policies, assessing such methane tariffs and charges as they may require, establishing the methane intensity of various supply streams, providing part of the monitoring framework for the certification of so-called “responsible gas,” holding polluters accountable, evaluating the impact of policies, identifying further abatement opportunities, rewarding responsible operators and communicating about their achievements in a trusted way. There is much work ahead that needs to be accomplished, but the MMRV technologies exist to facilitate the needed acceleration of methane abatement in the countdown to 2030.