Revolutionary tech gives players a market edge
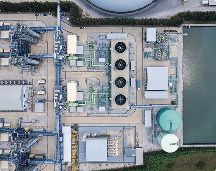
In an industry that lacks a thorough network of public intelligence, satellite imaging generates realtime data on liquefied natural gas (LNG) plant disruptions before they hit the market. Publicly-released data on LNG operations are scarce, rendering key realtime indicators — liquefaction utilization rates, train on/off rates and train outages — a blind spot.
Though companies may report periods of maintenance or technical disruptions, it’s nearly impossible to measure the precise periods of inactivity from start to finish. However, the impact of operations on the ground are later realized in shifting trade flows, import/export levels and spot prices. New techniques, like using satellite imaging to spot on-the-ground warning signs that may impact the market, are changing traditional LNG monitorization by providing the elements of a prognosis — such as maintenance schedules and outages — before their effects are reflected in the market.
Qatar is a big player in the LNG market boasting a large range of plants, but does not frequently release its data on maintenance periods and plant outages publicly. On-the-ground disruptions that may impact the market often go unreported. Furthermore, its maintenance program still has a big impact on the global market, since outages have a substantial impact on the country’s export levels. However, when a disruption on the ground occurs, it takes days for the process from maintenance to exports to reflect in the market. In April, Kayrros — a Paris-based technology firm — detected outages of multiple trains in Qatar in realtime, generating actionable data on the spot. One of these outages, picked up on Rasgas’ Train 3 on March 31 wasn’t reported in the news until over one week later.
Kayrros is leveraging alternative technologies to answer questions on LNG by processing satellite imagery — taken from satellites in multiple constellations — with machine-learning algorithms, sifting through high quantities of satellite imagery to track LNG on-the-ground operations. By combining these two technologies, the company can catch key LNG liquefaction indicators — like thermal anomalies and flaring signals — to monitor the status of LNG plants, including activity levels and outage alerts. Though, what’s been trending is not only the on-ground monitorization, but how certain events ripple through the market. Knowing them before they take effect is a new possibility promoted by the tech boom.
Leveraging the data revolution can soften the blow of abrupt market impacts. China recently slapped additional tariffs on US LNG imports, raising the tax from 10% to 25%. Since the US-China trade war started to take effect in July 2018, imports of US LNG to China started to decline, decreasing throughout 2018 with only two US LNG ships unloading in China in 2019. However, Kayrros satellite monitoring reveals that US liquefaction utilization rates — a key indicator of production — were on the rise throughout the decline, signaling that the US did not slow down production despite dwindling trade relations with China. Compiling this with import/export data reveals that China was quick to find new importers of LNG, taking shipments primarily from Australia with additional high numbers from Qatar and Malaysia.
For traders, this new technology is generating a huge buzz. Outages, maintenance and restarts often have an immediate impact on traders’ physical supply chains of gas, causing the need to look for a replacement cargo. Additionally, disruptions have an immediate impact on the short-term supply and demand balances of physical LNG, which add or remove cargoes from the market. Activity levels affect LNG financial prices (JKM) as a consequence, and give traders the opportunity to express that information as a trade before word gets out.
Technology is presenting new opportunities respond to old problems in the LNG industry. As LNG continues to develop, the role of natural gas in power generation, transportation and petrochemicals is becoming more prominent, opening the door for new technologies to revolutionize monitorization as the demand for it continues to grow.


