









LNG Intelligence für Trader

///

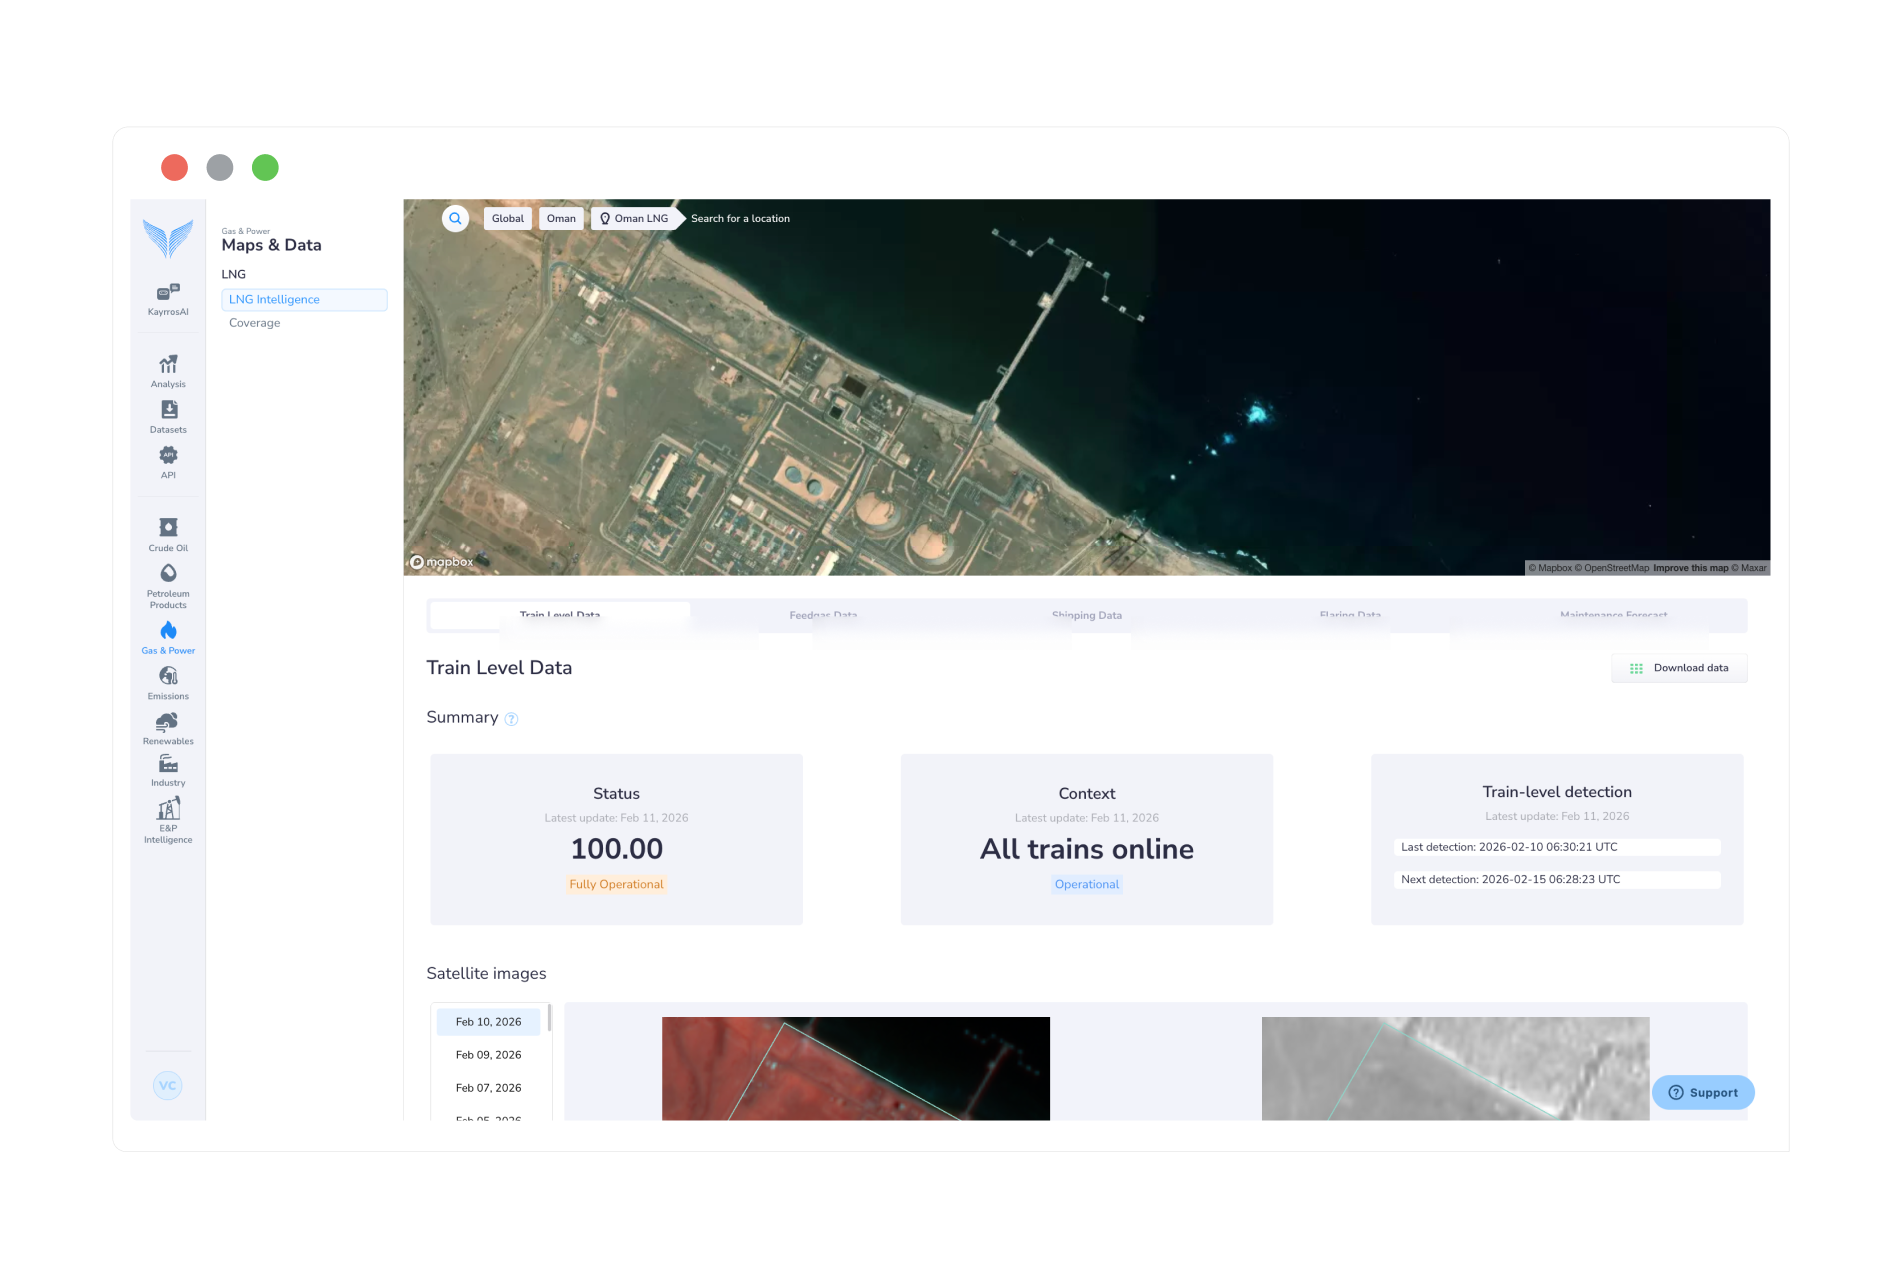
Kayrros LNG Intelligence ist die zuverlässigste und schnellste Informationsquelle zu weltweiten Versorgungsunterbrechungen im LNG-Markt – ideal für LNG- und Gas-Trader.

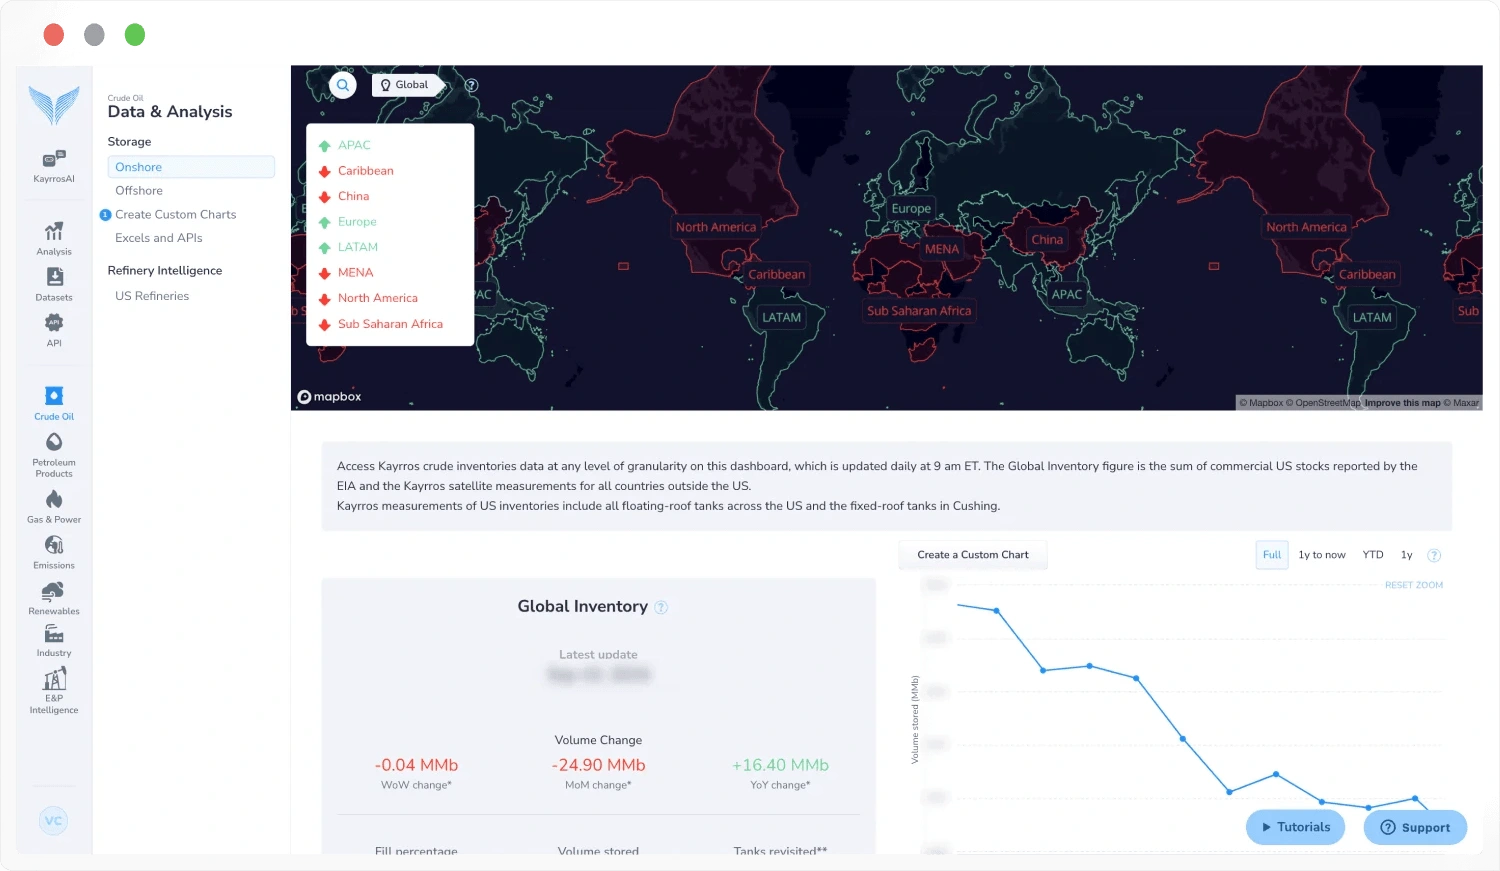
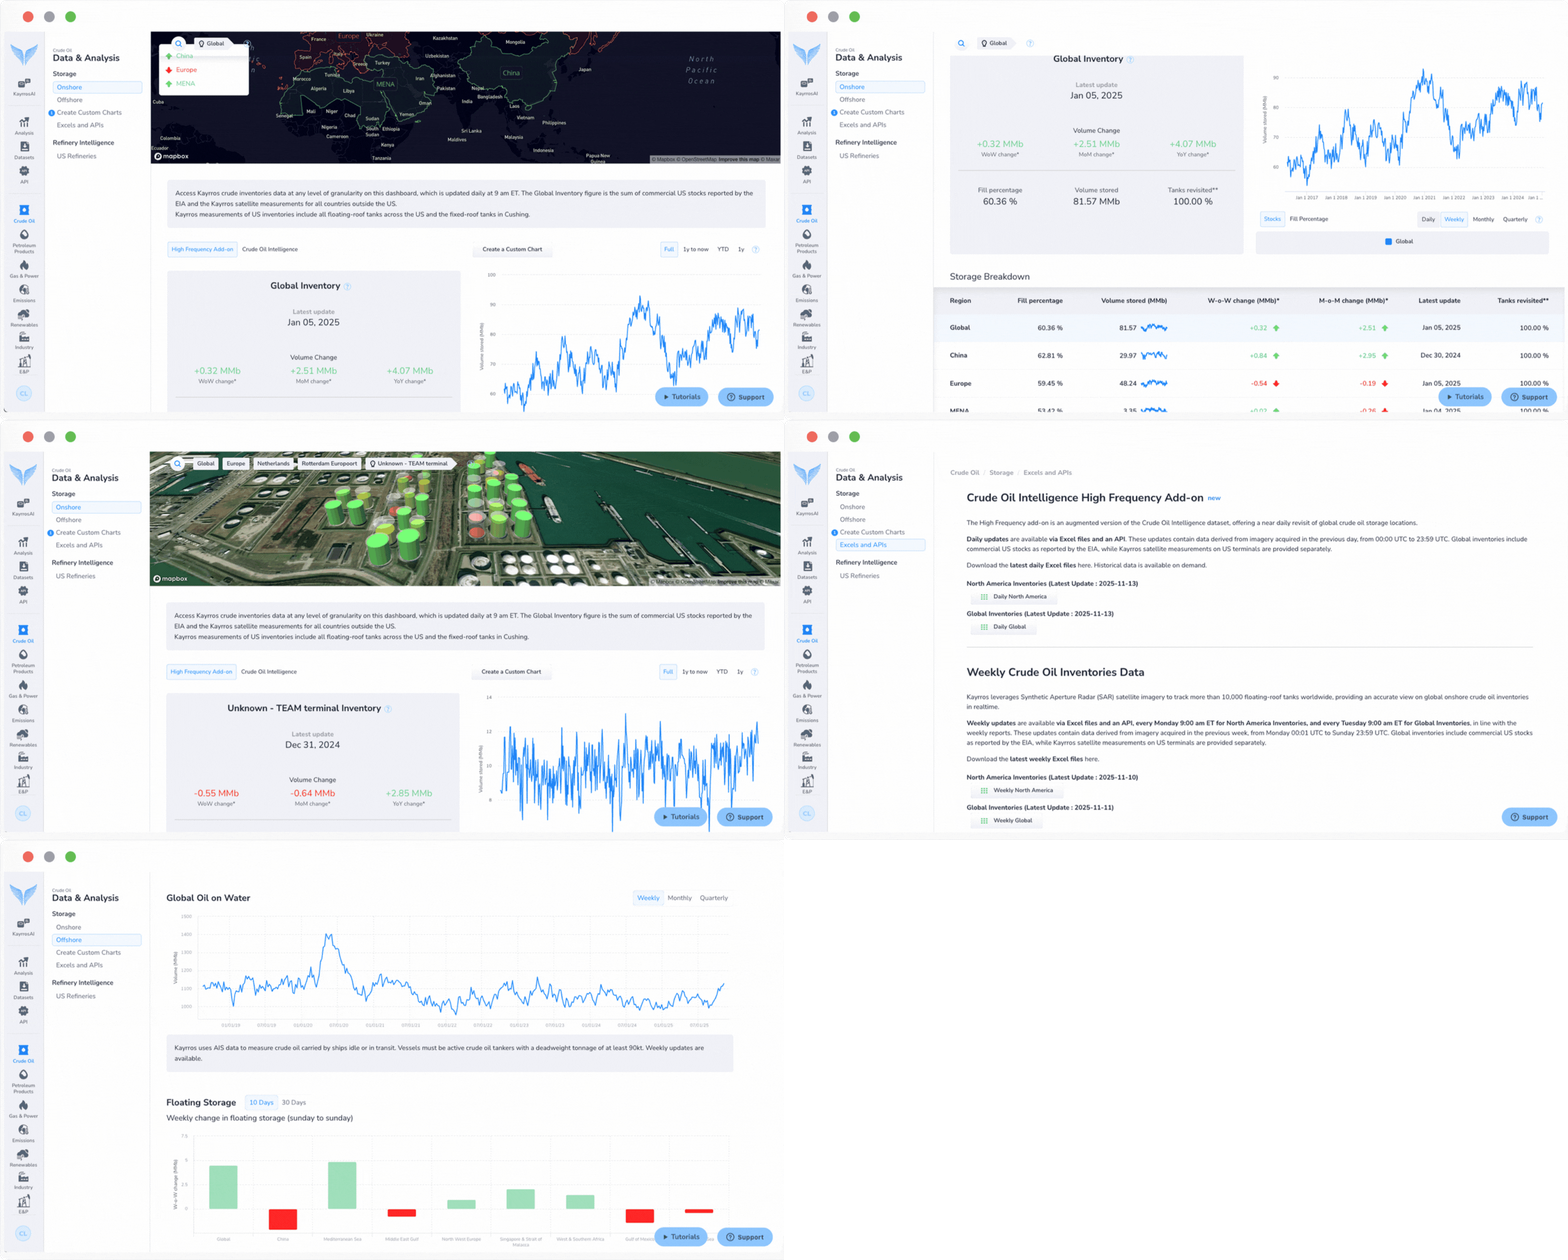
Crude oil inventory data dashboard displaying real-time market intelligence

Recognized and quoted by:

Was ist LNG Intelligence für les Traders

///

Kayrros LNG Intelligence kombiniert mehrere Echtzeit-Datenquellen und liefert damit die umfassendste und aktuellste Sicht auf das globale LNG-Angebot.
Erfahren Sie als Erster von Ausfällen oder Wiederanläufen von LNG-Verflüssigungsanlagen weltweit – oft Tage vor anderen Anbietern – und passen Sie Ihre kurzfristigen Positionen und Bilanzen entsprechend an.

GLOBALES LNG ANGEBOT

98%

der Ausfälle werden weltweit erkannt

<24h

um über einen Ausfall und Neustart informiert zu werden

10y+

Historische Daten

///  

Warum ist Kayrros LNG Intelligence einzigartig?

Modernste Algorithmen, angetrieben durch Kayrros-Datenfusion

Proprietäre KI-Algorithmen, die Eingaben von mehreren Satellitenkonstellationen nutzen und mit Feedgas-, Abfackel- und Versanddaten fusionieren.

dashbords

Höchste Erkennungsleistung auf dem Markt

Durch den multisource-Ansatz erkennt Kayrros 98 % aller Ausfälle und Neustarts – und informiert innerhalb von 24 Stunden.

Einzigartige historische Datenbank

Kayrros LNG Intelligence bietet eine einzigartige Datenbank mit 10 Jahren historischen Daten.

///

Optimieren Sie Ihre LNG-Handelsentscheidungen

Profitieren Sie von der globalen Abdeckung der LNG-Verflüssigungsanlagen

Nutzen Sie die aktuellsten Daten zu Versorgungsunterbrechungen

Nutzen Sie mehr als 10 Jahre historischer Daten und Ausfallklassifizierungen für eine noch nie dagewesene Genauigkeit bei Wartungsprognosen

///

Unsere funktionen der LNG-Intelligence

Zeitnahe Warnungen bei Ausfällen und Wiederanläufen

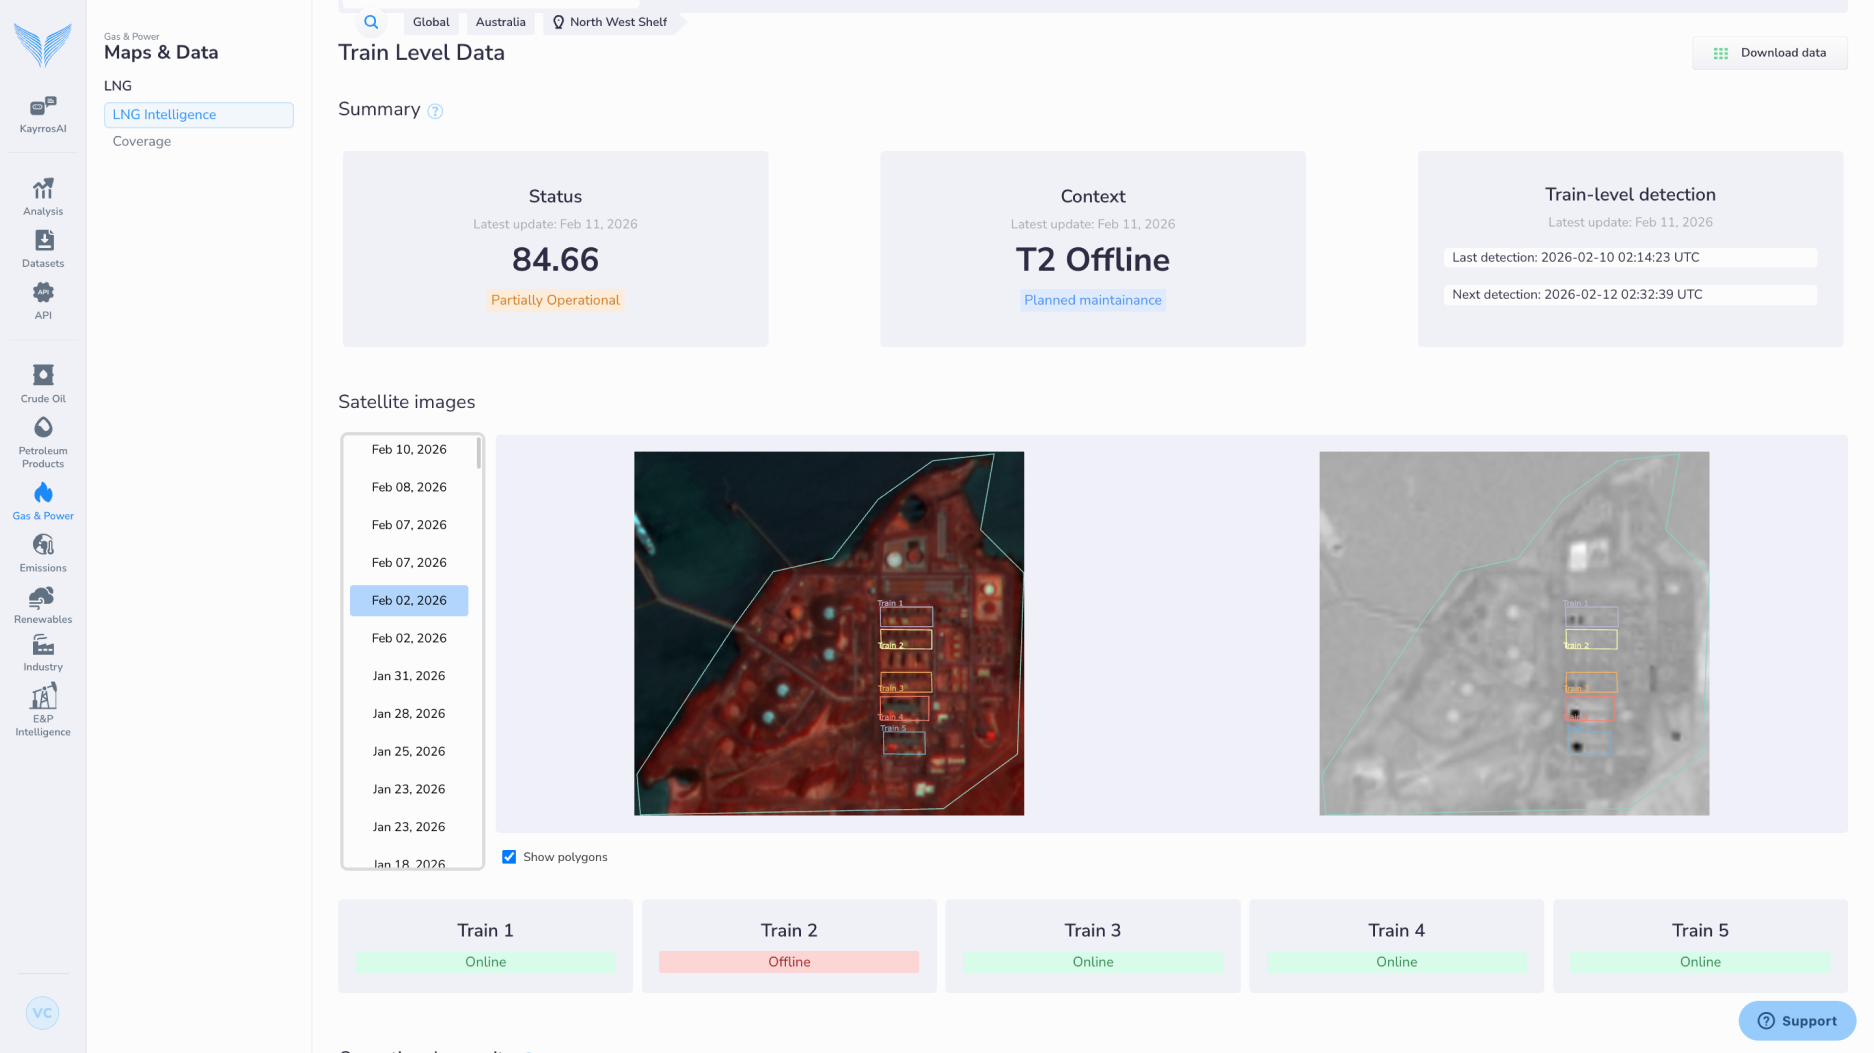
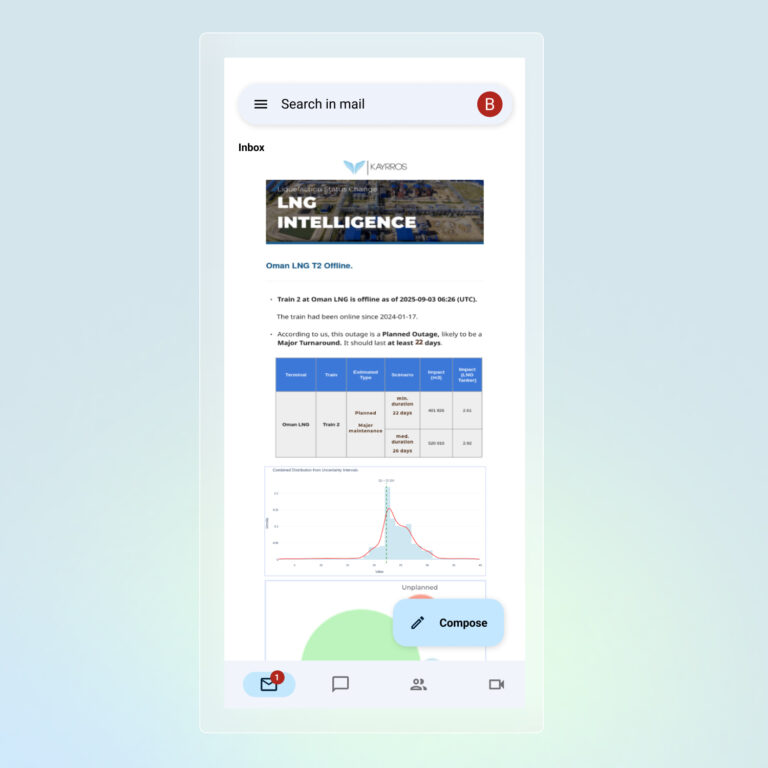
Erhalten Sie nahezu in Echtzeit Warnungen über Ausfälle und Wiederanläufe in LNG-Verflüssigungsanlagen weltweit, mehrere Tage früher als andere Datenquellen.

Betriebszeit- und Auslastungsprognosen

Nutzung von 10 Jahren eines einzigartigen Datensatzes zur Analyse von Mustern und zur Vorhersage der künftigen Produktion

Eine mehrdimensionale Ansicht der Aktivität von LNG-Anlagen

Zugriff auf einen umfassenden Überblick über die Aktivität von LNG-Anlagen, einschließlich Störungsmeldungen, Feedgas-, Abfackel- und Versanddaten.

Frequently Asked Questions about LNG Intelligence

Product Overview & Coverage

What core insights does the LNG Intelligence product deliver?

 The product monitors key operational metrics to give you a clear view of global supply dynamics:
  • Train Level Activity: Daily tracking of LNG production activity at the individual train level.
  • Flaring Data: Daily flaring intensity analyses that help you anticipate past, current, and impending changes in production levels.
  • Feedgas Data: Consolidated daily feedgas nominations designed to quickly catch liquefaction outages in the United States and Eastern Australia.
  • Shipping: Access to import and export data tracking.

What is the geographic and volume coverage?

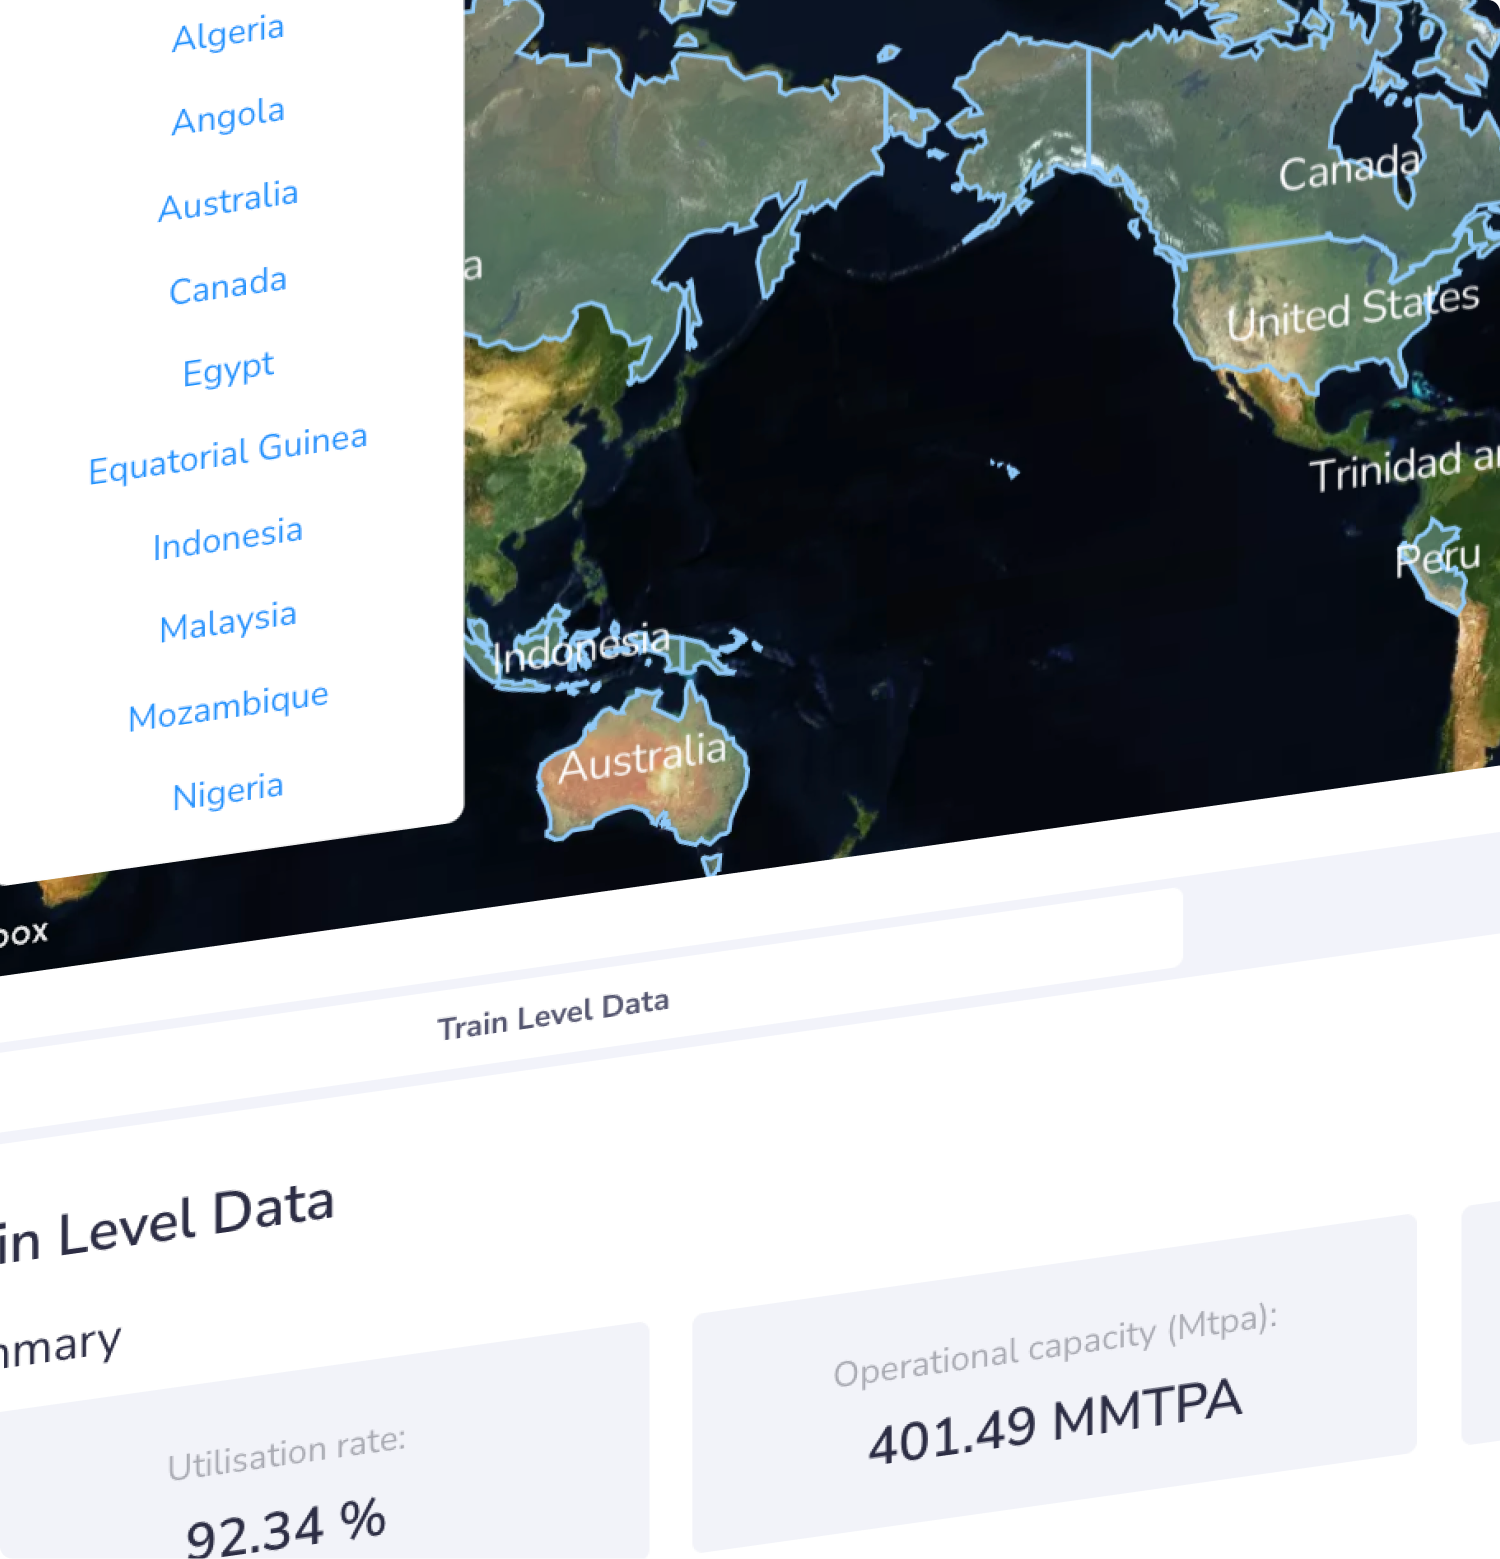
  • The dataset tracks 400 MMtpa of liquefaction capacity.
  • This represents more than 45% of the total installed capacity in the world.

Are Floating LNGs (FLNGs) covered?

  • No. FLNG liquefaction status is not included in the LNG Intelligence product.
  • Unlike onshore facilities, FLNG trains are cooled by water instead of air. Because of this, the algorithm cannot detect the heat emissions from these production trains.

How much historical data can I access?

  • Liquefaction & Flaring: Operational status and flaring datasets begin in 2013.
  • Shipping: The shipping-specific dataset begins in 2018.

Is the data subject to revisions?

  • No. The data is strictly point-in-time. Once a data point is published, it is never revised.

Do you provide shipping destination forecasts?

  • No. The product does not provide LNG tanker destination forecasts at this moment. This is why ongoing LNG vessel voyages are not visible on the platform.

How do I navigate to the LNG dashboard?

  • Log into the Kayrros Portal at app.kayrros.com/dashboard 
  • Select Gas & Power from the left-hand menu and click on the LNG Liquefaction Plant Monitor tile.

What pages are available inside the LNG section?

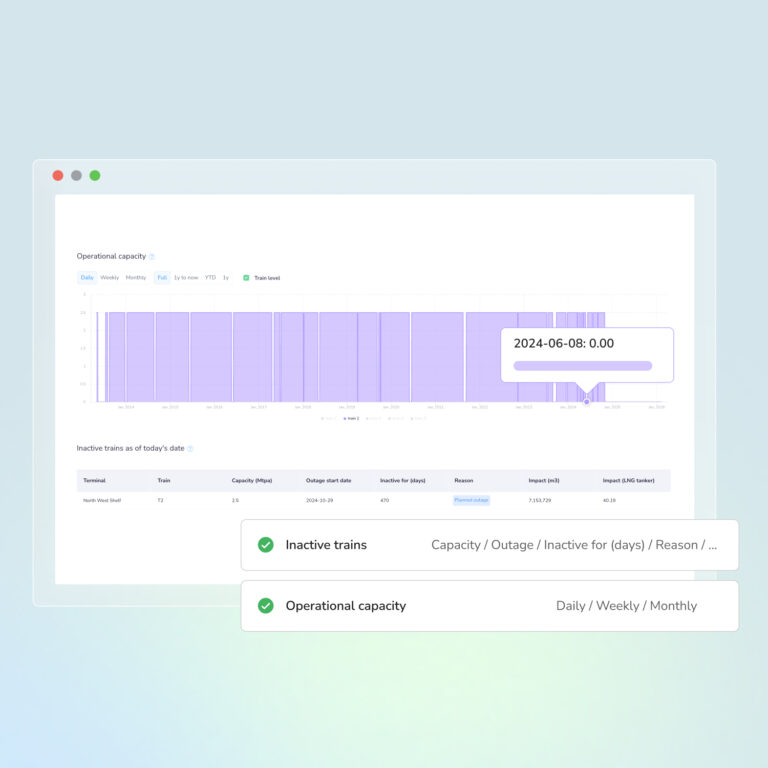
  • Liquefaction Capacity Monitor: A Tableau dashboard that centralizes all liquefaction status alerts, feedgas data, and flaring events.
  • LNG Shipping Dashboard: A dedicated space for shipping data.

Can I download this data into Excel?

Yes. Within the “Liquefaction Capacity Monitor” page, you can use the “Download Data” button to pull Excel files for:

  • Historical Liquefaction Capacity data (located in the Liquefaction Status Map section).
  • Flaring data (located in the Latest Flaring Events section).
  • Feedgas data (located in the Feed Gas by Facility section).

Is there an API available for algorithmic trading?

  • Yes. Kayrros provides a standard REST API with various endpoints for different datasets.
  • If you do not want to query the REST API directly, Kayrros provides a Python wrapper. This allows you to perform the same data queries using simple Python functions, which can be downloaded directly from the portal’s API setup documentation.

When will I receive automated email alerts?

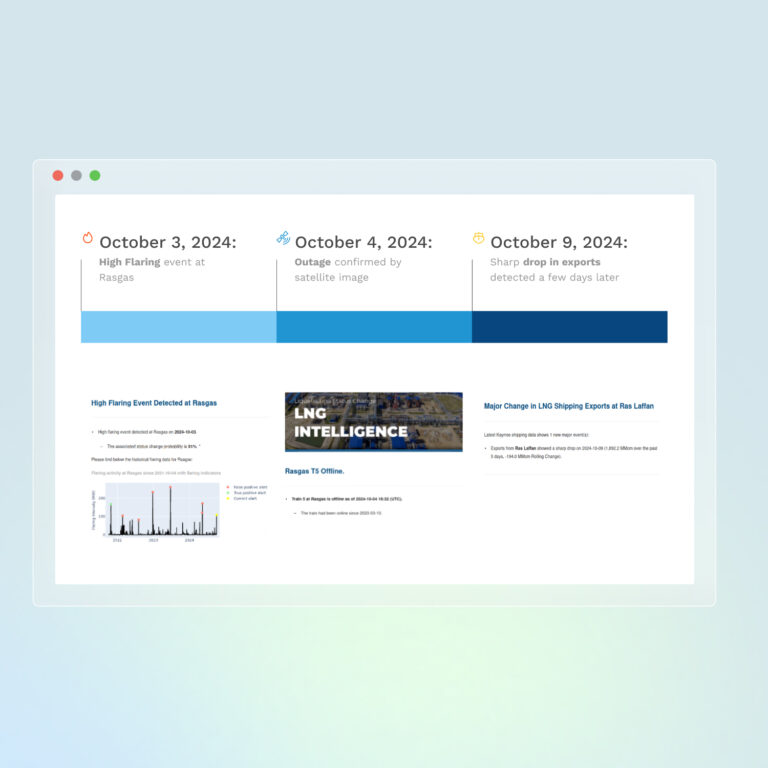
To ensure you don’t miss sudden market shifts, alerts are instantly generated when:

  • A train outage or production restart is detected.
  • A high flaring event is detected.
  • A major change in feedgas flows occurs in the US or Australia.
  • A major shipping export change is identified.

Do you provide regular summaries or specialized lists?

  • Weekly Recap: Every Thursday, you will receive an automated summary detailing the events of the past week.
  • High Flaring Events Mailing List: You can request to join this specialized list. Every time a high flaring event triggers an alert, it will include the statistical probability of an associated production outage or restart.

WAS IST INKLUDIERT?

WeeklyReports

Realtime Alerts

Kayrros bietet Sofortwarnungen für jede neue Störungsmeldung

API

Rest-API

Kayrros ermöglicht den Zugriff auf Daten über REST- oder Python-APIs

dashbords

Dashboards

Kayrros bietet vollständige Dashboards für LNG-Angebotsdaten mit dynamischer Visualisierung

Erlebe die Kraft
von Kayrros LNG Intelligence aus erster Hand

Optimieren Sie Ihre Handelsentscheidungen mit nahezu Echtzeit-Transparenz über globale Störungen der LNG-Versorgung.

Crude oil inventory data dashboard displaying real-time market intelligence